The BEAGLE Microplastics North Atlantic Project: Laboratory sample treatment
Laboratory sample treatment and analysis at Helmholtz-Zentrum Hereon
A blank was introduced in the laboratory at the beginning of the sample treatment stage. The samples were filtrated on 5 µm polytetrafluoroethylene (PTFE) filters using a stainless-steel manifold vacuum filtration system. Using MQW and filtered ethanol, the residuals were rinsed from the PE bags that were then discarded. The samples were washed using MQW.

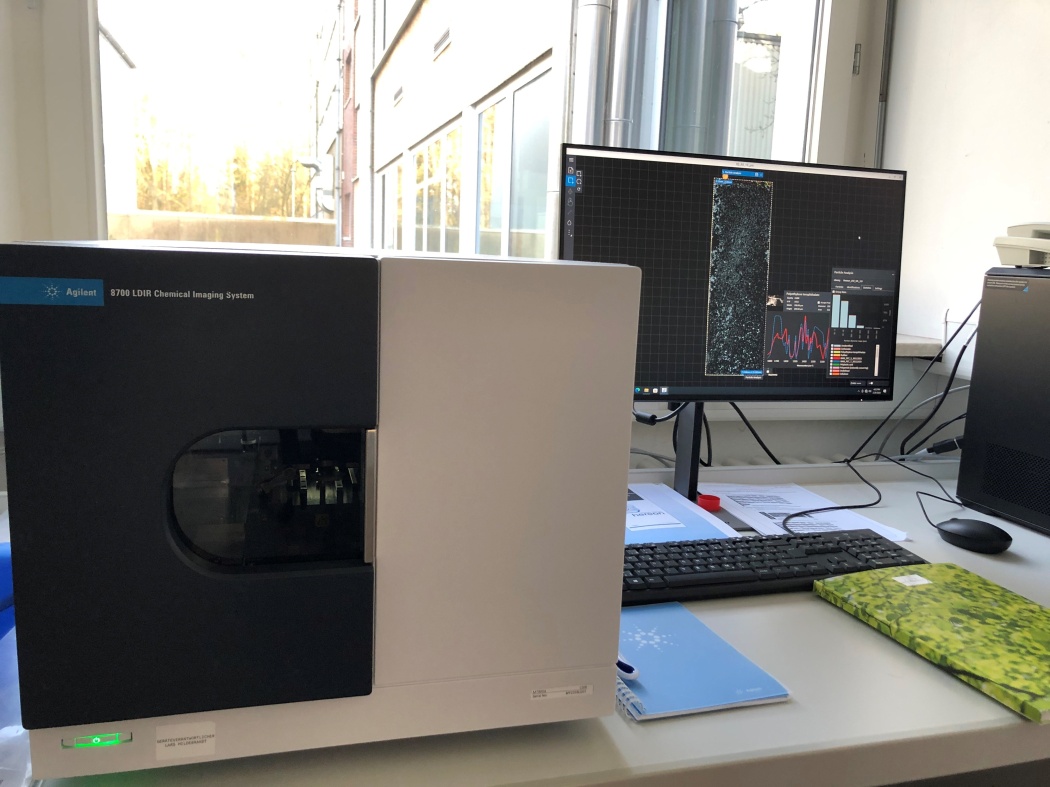
Sample analysis at Hereon (Photo by Hereon)
A 30 % (w:V) solution of hydrogen peroxide (H2O2) was filtered over a 0.4 µm PC membrane. The PTFE filters with the samples were then suspended in 25 mL of this solution in 250 mL glass bottles covered with aluminum foil with a small opening. The mixture was heated to 45 °C for 24 hours on an orbital shaker and then filtrated on 5 µm PTFE filters.
Again, using MQW and filtered ethanol, the residuals were rinsed from the previous PTFE filters that were subsequently discarded. The samples were washed using MQW.
Subsequently, the samples underwent density separation. For this, a solution of zinc (II) chlo-ride (ZnCl2) in MQW with a density of 1.7 g/mL was prepared and filtered twice over 1 µm glass fiber filters that had previously been heated to 250 °C overnight.
The sample was covered with this solution and scraped of the filter using a PTFE spatula. The PTFE filter was rinsed and discarded, and the sample was suspended in 70 mL of the ZnCl2 solution in a 100 mL separatory glass funnel using a PTFE stopcock and a glass stop-per. The separatory funnel was covered with aluminum foil and set aside for at least 24 hours. Subsequently, the bottom 50 mL containing the heavier constituent of the sample were released and the ZnCl2 solution was later recycled through double filtration. The re-maining suspension was filtered onto 5 µm PTFE filters and the separatory funnel as well as the sample were thoroughly rinsed and washed with 1.3 % (w:V) HCl, MQW and ethanol in that order.
Detection and analysis of microplastics
The particles > 300 µm were manually transferred to silver coated MirrIR low e microscope slides except for some fibers. The transflection-mode infrared spectroscopic measurements were carried out using two Agilent 8700 Laser Direct Infrared (LDIR) Chemical Imaging Systems with the Agilent software Clarity version 1.6.0 beta.
The particle sensitivity was set to 0.10 out of 0.16 as maximal sensitivity and only the particles in the size range of 20 – 5000 μm were considered. The spectra were measured with a spectral resolution of 8 cm−1 and the obtained spectra were compared to a spectral library provided by Agilent Technologies (Microplastic starter 2.0) that was expand-ed by a variety of self-generated spectra from various (semi-)synthetic polymers. Identified MPs with a hit quality index (HQI) > 0.85 were accepted. Generally, tire abrasion, synthetic polyamide, and rubber were excluded from the results since the detection via LDIR imaging was not reliable enough. PTFE was excluded due to potential contamination from the uten-sils used.
Data evaluation
The particles > 300 µm were manually transferred to silver coated MirrIR low e microscope slides except for some fibers. The transflection-mode infrared spectroscopic measurements were carried out using two Agilent 8700 Laser Direct Infrared (LDIR) Chemical Imaging Systems with the Agilent software Clarity version 1.6.0 beta. The particle sensitivity was set to 0.10 out of 0.16 as maximal sensitivity and only the particles in the size range of 20 – 5000 μm were considered. The spectra were measured with a spectral resolution of 8 cm−1 and the obtained spectra were compared to a spectral library provided by Agilent Technologies (Microplastic starter 2.0) that was expand-ed by a variety of self-generated spectra from various (semi-)synthetic polymers. Identified MPs with a hit quality index (HQI) > 0.85 were accepted. Generally, tire abrasion, synthetic polyamide, and rubber were excluded from the results since the detection via LDIR imaging was not reliable enough. PTFE was excluded due to potential contamination from the uten-sils used.
The imaging data of all identified particles was exported from the Clarity software as a comma-separated values file containing the geometrical information, polymer types, and HQIs. A custom written excel sheet facilitated the filtering by HQI and clustering by polymer type and size. The software ArcGIS Desktop 10.8.1 was used to create the map.
-
 Beagle Atlantic Sample No. 12 (Photo by Hereon)
 -
 Beagle Atlantic Sample No. 15 (Photo by Hereon)
 -
 Beagle Atlantic Sample Microplastic (Photo by Hereon)
 -
 Beagle Atlantic Sample Microplastic with LDIR (Photo by Hereon)